colorlab SOFTWARE
TO PERFORM COLOR ANALYSIS OF MUST AND WINE
FILL OUT THE FORM TO GET THE FREE DEMO
FILL OUT THE FORM TO GET THE FREE DEMO
DNAPhone has long been the reliable partner of wineries and laboratories, providing color analysis with the CIELab method, adhering to the OIV method. We have made CIELab analysis quick and easy, but today we want to share with you one more step in innovation.
ColorLab is the Web APP that can be used from fixed PC or MAC computer or any other portable platform (e.g.tablet), compatible with any traditional laboratory spectrophotometer that enables advanced color analysis. Watch the video:
With ColorLab you will be able to:
FILL OUT THE FORM TO GET THE FREE DEMO
SMΔRT ANALYSIS platform
For customers who do not already have a spectrophotometer, we provide a complete portable Spectrophotometer analysis system (patented), managed through an APP dedicated to the analysis of wine color.
All color analyses performed with the SMΔRT ANALYSIS platform are automatically uploaded to ColorLab Software for convenient processing.
In 2006, the International Organization of Vine and Wine (OIV), replaced and downgraded the “classical” method based on the measurement of absorbance at three wavelengths with the CIELab method, which has thus become the reference method (type 1) for wine color analysis.
Why?
CLASSICAL METHOD
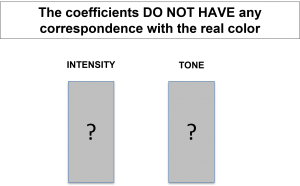
Downgraded to an auxiliary method by OIV because it does not allow objective and unambiguous assessments of color and does not provide process information
⇒ uses 3 wavelengths 420-520-620 nm.

CIELAB METHOD
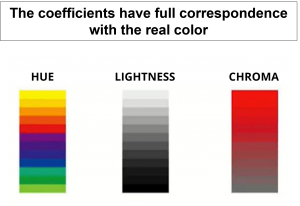
Chosen as the reference method by OIV, it is the only scientific method that uniquely and objectively measures wine color
⇒ uses 80 wavelengths between 380 and 780 nm.


FOSS ITALY chose DNAPhone’s platform because of the synergy with our analysis solutions. SMΔRT ANALYSIS allows us to offer customers not only the 420 nm, 520 nm and 620 nm color measurement with IC and Hue, but especially the CIELab one. It is a patented solution that completes the framework of analysis that we are asked for by the market.


Smart Analysis is a tool that I liked immediately because of its simplicity in use. Sample preparation and use of the kits is very simplified. I was thrilled to see the results of tint intensity, hue, etc. on the tablet… The tool offers the possibility to create graphs directly, I find this an exceptional thing.
In analyzing the color of rosé wines, we started with the classical method, but it was not exhaustive, the values were not comparable to the visual aspect. We switched to Smart Analysis because it does color measurement using polar coordinates. Once the measurements are taken, a complex algorithm returns the values graphically. It is a tool that has me enthralled and intrigued.

FILL OUT THE FORM TO GET THE FREE DEMO